


Russia
An auxiliary tool for automatic detection and visualization of price channels based on fractal peaks and geometric analysis. The indicator is intended exclusively for manual trading and suits traders who follow a structural market approach. It identifies channels using multiple criteria: number of touches, slope, filling density, breakout depth, and relative position of fractals. Flexible customization is available for any price chart.
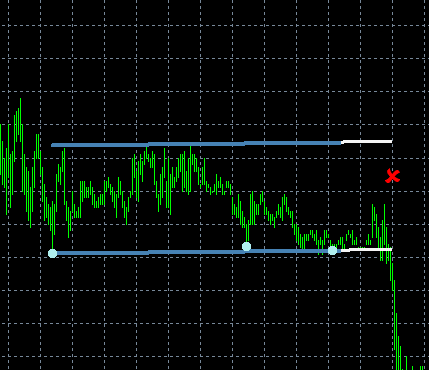
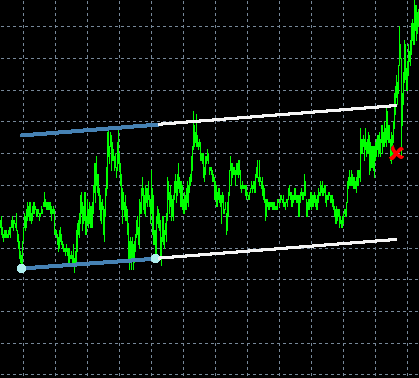
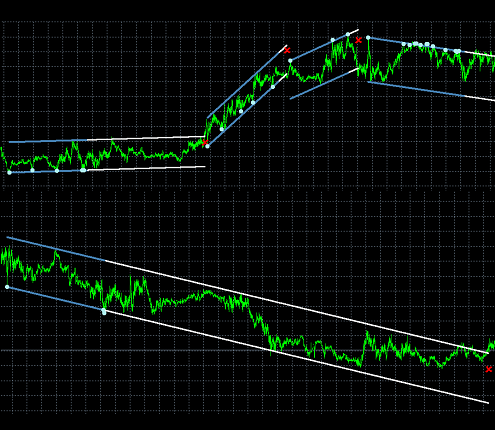
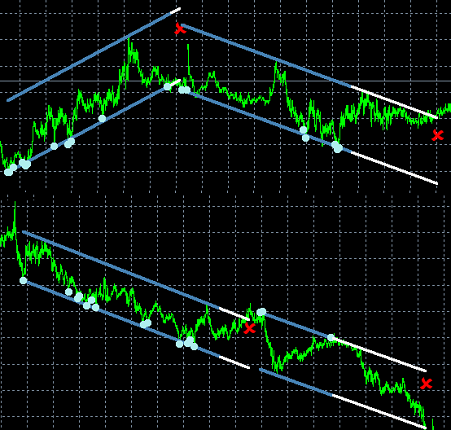
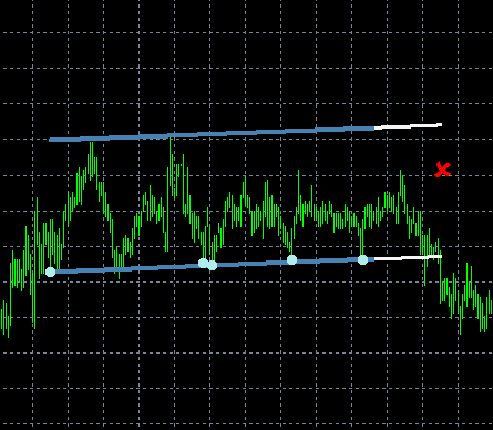
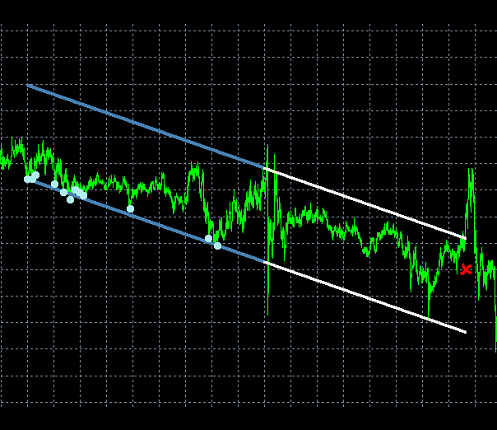
Examples of detected channels:
Who is this indicator for?
|
Key Features and Advantages
| Multi-Approach Analysis | The indicator searches for channels based on fractals, verifying geometry, touch density, slope, and breakout resilience — all in one tool. |
| Flexible Visualization | Full control over display: you can enable/disable points, channel lines, follow-up mode, colors, and line thickness. |
| Sound and Text Notifications | The indicator can alert you about new channels, their continuation, or breakouts — via sound or messages in the «Experts» tab of the MetaTrader terminal. |
| Resource Efficiency | Automatic cleanup of old objects and limiting the number of displayed channels "Last Channels In Memory" prevents chart overload. |
| Intuitive In-Chart Interface | Built-in buttons «REDETECT», «HIDE», «STOP», and panel corner selection. |
Recommendations
|
How it works — in simple terms
| The indicator scans the last N candles looking for fractal peaks (local highs/lows), defined by the "Fractal Among "X" Candles" parameter. It then checks whether a support or resistance line can be drawn through two such peaks so that there are enough touches between them "Min./Max. Contacts About Border" and the distance between peaks falls within the specified range "Min./Max. Bars Between Construction Fractals". Next, the channel’s slope and “filling” are evaluated. If all conditions are met, the channel is displayed on the chart. In "Use Following Mode", the indicator continues tracking price: if the channel persists, it remains active, and when price exits its boundaries — a signal is triggered indicating the channel’s end. |
Indicator Input Parameters
| Category | Parameter | Description |
| Main | ||
| Search In Last "N" Candles | Number of most recent candles used for channel detection. Increasing this speeds up analysis but reduces depth. | |
| Min. Bars Between Construction Fractals | Minimum distance (in bars) between fractals used to build the channel. | |
| Max. Bars Between Construction Fractals | Maximum distance between fractals. Channels built on overly distant peaks are ignored. | |
| Fractal Among "X" Candles | Fractal dimension: peak is detected at the center of an X-candle segment (only odd values: 3, 5, 7...). | |
| Min. Contacts About Border | Minimum number of price touches on the channel line required for confirmation. | |
| Max. Contacts About Border | Maximum allowed number of touches — filters out “clumped” channels. | |
| Rel. Dev. Of Fractals From The Line | Maximum relative deviation of a fractal from the channel line (as a fraction of the total price range). | |
| Rel. Rem. Of The First Fractal From A Distant Fractal | Minimum relative distance between the initial and distant fractal — excludes overly “compressed” channels. | |
| Rel. Filling Of A Starting Parallelogram | Minimum filling of the initial parallelogram by the channel — filters out “empty” structures. | |
| Relative Exit For Borders | Maximum allowed price exit beyond channel boundaries during active tracking (in follow-up mode). | |
| Min. Inclination Of The Channel | Minimum absolute channel slope (in points per bar). Filters out horizontal “noise”. | |
| Max. Inclination Of The Channel | Maximum allowed slope — excludes sharp, unstable channels. | |
| Sounds | Play Warn. Sound On Detect | Play sound when a new channel is detected. |
| Play Warn. Sound On Following | Sound alert when the channel continues successfully (price stays within boundaries). | |
| Play Warn. Sound On Following Break | Sound alert when the channel boundary is broken and the channel ends. | |
| Messages | Message On Detect | When a new channel is detected, a message is logged to the "Experts" tab in your MetaTrader terminal. |
| Message On Following | When the current channel remains active, a message is logged to the "Experts" tab in your MetaTrader terminal. | |
| Message On Following Break | When the current channel is broken, a message is logged to the "Experts" tab in your MetaTrader terminal. | |
| Display Modes | Draw Points | Display fractal points used in channel construction. |
| Draw Lower Line | Draw the lower channel boundary. | |
| Draw Upper Line | Draw the upper channel boundary. | |
| Use Following Mode | Enable follow-up mode: the indicator continues tracking the channel in real time. | |
| Old Line Cleaning | Automatically delete old channels, keeping only the most recent ones. | |
| Last Channels In Memory | Number of channels kept simultaneously on the chart. | |
| Styling | Lower Line Color | Color of the lower channel line. |
| Upper Line Color | Color of the upper channel line. | |
| Lower Help Line Color | Color of the extended lower line in "Following" mode. | |
| Upper Help Line Color | Color of the extended upper line in "Following" mode. | |
| Points Color | Color of fractal points. | |
| Lines Width | Thickness of all channel lines (from 1 to 50). | |
| Points Width | “Boldness” of fractal points. |
For those using GogoJungle for the first timeEasy 3 steps to use the product!
At GogoJungle, we provide services to enrich your investment life for our members. In addition, product purchases are normally limited to members. Why not register as a member now and make use of GogoJungle!