


An auxiliary tool for automatic detection and visualization of nascent stages of complex price formations. The indicator is intended exclusively for manual trading and suits traders who experiment with early recognition of advanced market patterns or trends—of which simpler formations may be a part. It identifies up to six types of initial formations: parabolas with peaks at the far or near candle, harmonic oscillations with adjustable decay, linear breakouts, and more. All formations are evaluated based on accuracy, size, duration, and robustness. Flexible appearance customization and advanced search logic are provided.
Who is this indicator for?
|
Key Features and Advantages
| Multi-Formation Analysis | The indicator simultaneously searches for 6 formation types: parabolas, harmonics, linear breakouts — each with individual settings. |
| Customizable Visualization | For each formation, you can configure the color of the main line, help line, label, thickness, and vertical offset relative to price. |
| Text Labels and Sound Alerts | Upon detecting a new formation, the indicator can display a text label and/or play a sound — both are independently configurable. |
| Memory Management | Automatic cleanup of old formations via "Last Splines In Memory" keeps the chart clean and readable. |
| Intuitive In-Chart Interface | Built-in buttons «REDETECT», «HIDE», «STOP», and panel corner selection — all controls are directly on the chart. |
Recommendations
|
How It Works — In Simple Terms
| The indicator analyzes recent candles and attempts to approximate price movement using one of six mathematical models: an "n"-degree parabola, a harmonic wave with decay decrement, a linear breakout, etc. Each model is verified against criteria such as minimum/maximum size (in points and candles), approximation accuracy ("Accuracy"), and robustness to outliers. If a formation passes all filters, it is displayed on the chart with a text label and, optionally, accompanied by a sound alert. You can independently enable or disable the search for each formation type. |
Indicator Input Parameters
| Category | Parameter | Description |
| Main | Show Basic Spline | Display the main line of each detected formation. |
| Show Help Spline | Display a parallel help line (offset upward in price). | |
| Show Spline Labels | Display text labels with the formation name. | |
| Play Warn. Sound On Detect | Play a sound when a new formation is detected. | |
| Message On Detect | Write a message to the «Experts» tab of the MetaTrader terminal. | |
| Clean Old Splines | Automatically remove old formations, keeping only the most recent ones. | |
| Last Splines In Memory | Number of formations kept simultaneously on the chart. | |
| Font Size | Text label font size (from 8 to 30). | |
| Font Y Coordinate Accumulation | Vertical offset of the text label relative to its anchor point. | |
| Font X Coordinate Accumulation | Horizontal offset of the text label relative to its anchor point. | |
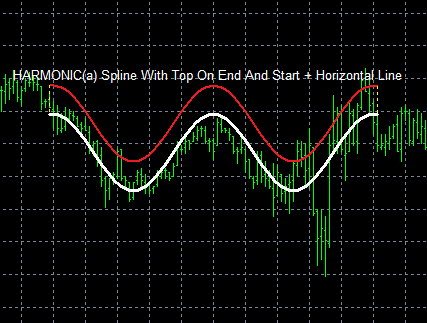
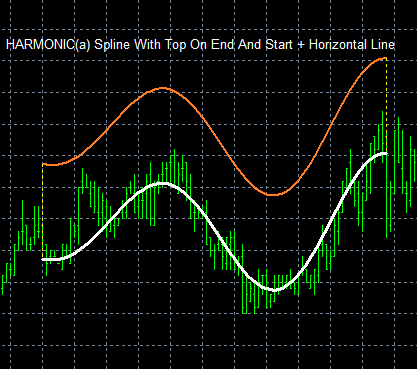
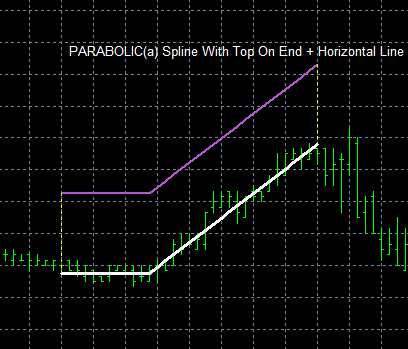
| Enable Formation Search | Searching PARABOLIC(b) | Search for parabolas with the peak at the far candle. |
| Searching PARABOLIC(a) | Search for parabolas with the peak at the far candle and a horizontal extension after it. | |
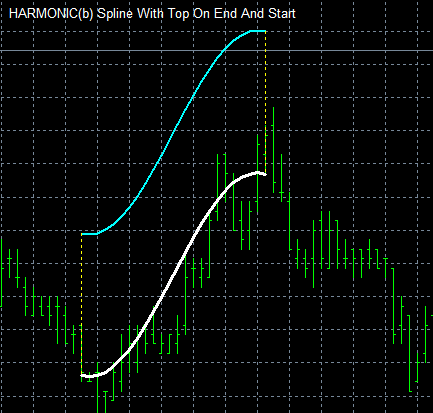
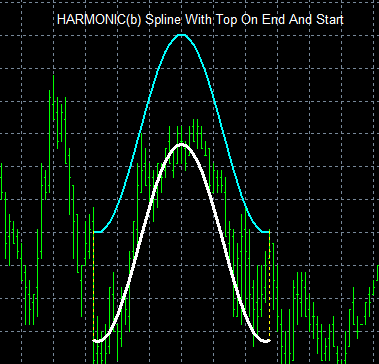
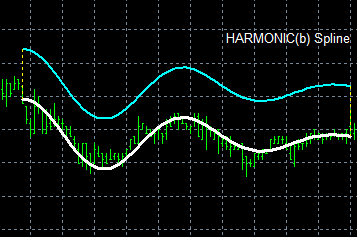
| Searching HARMONIC(b) | Search for harmonic oscillations without horizontal continuation. | |
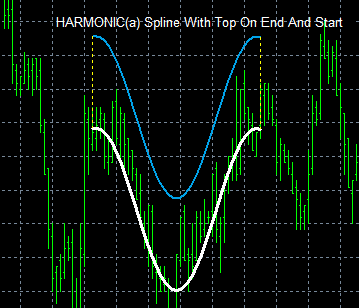
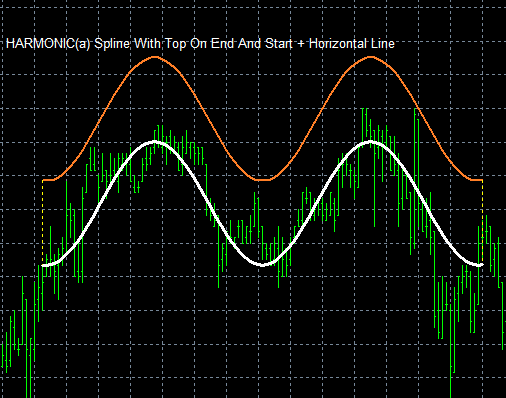
| Searching HARMONIC(a) | Search for harmonics with a horizontal line after the last crest. | |
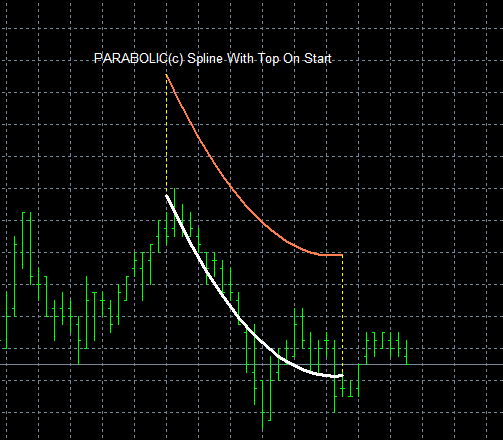
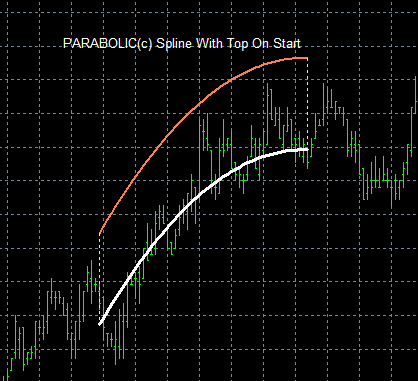
| Searching PARABOLIC(c) | Search for parabolas with the peak at the near candle. | |
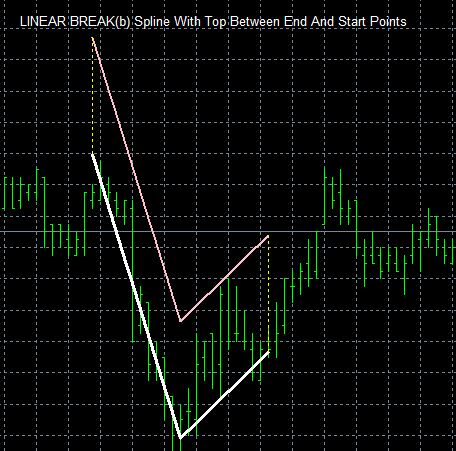
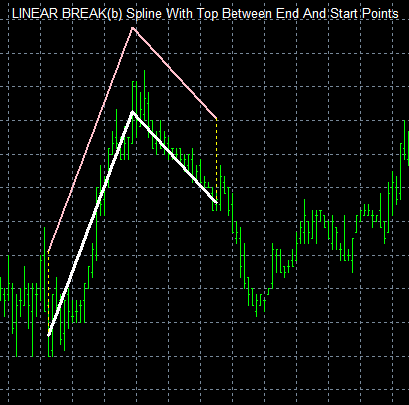
| Searching LINEAR BREAK(b) | Search for linear breakouts with an inflection point between start and end. | |
| Individual Formation Parameters | To save space and avoid duplication, the parameters below apply to all formation types (PARABOLIC, HARMONIC, etc.) using consistent naming. For example, the "Label" parameter for "PARABOLIC(b)" is named "PAR.(b) Label", for "HARMONIC(a)" — "HAR.(a) Label", and so on. | |
| Label | Formation label text (e.g., "PARABOLIC(b) Spline With Top On End"). | |
| Label Color | Text color of the label. | |
| Main Spline Color | Color of the main formation line. | |
| Help Spline Color | Color of the help line. | |
| Help Dot Color | Color of the dotted (DOT-style) line. | |
| Widht Main Spline | Thickness of the main line (1–10). | |
| Widht Help Spline | Thickness of the help line. | |
| Widht Help Dot | Thickness of the dotted line. | |
| Help Spline Y | Upward offset of the help line (uses "_Point" units). | |
| Min Point's Size | Minimum formation amplitude (uses "_Point" units). | |
| Max Point's Size | Maximum formation amplitude (uses "_Point" units). | |
| Min Bougie Size | Minimum duration in candles. | |
| Max Bougie Size | Maximum duration in candles. | |
| Exponent | Parabola degree (applies only to parabolic formations). | |
| Decrement Variation | Number of decay decrement steps (applies only to harmonics). | |
| Top Variation Accuracy | Inflection point search accuracy (applies only to linear breakouts). | |
| Relative Lengthening Left | Relative leftward extension of the line (0.0 = no extension, 1.0 = double length). | |
| Relative Lengthening Right | Relative rightward extension of the line. | |
| Accuracy | Minimum approximation accuracy (higher = stricter filter). | |
GogoJungleを初めてご利用する方へ商品のご利用まではかんたん3ステップ!
GogoJungleでは、会員様向けに、あなたの投資生活を豊かにするサービスをご用意しております。また、商品のご購入は通常会員様に限られさせていただいております。今すぐ会員登録をして、Gogojungleを活用してみませんか!