List Go to GogoJungle Home
icon List
Go to GogoJungle Log In Create Article
Learn USD/JPY with real examples and data Investment Navi+
Learn USD/JPY with real examples and data
tack
0
0

Share


This ongoing series compiles viewpoints that can be used to judge trades based on actual USD/JPY charts and historical data (including convenient timeframes, days, and how to use horizontal lines). In some issues, a quick-reference table and a calendar (PDF) are attached for pre-trade checks. The chart lines are automatically drawn with the MT5 indicator "Okome Horizontal Line" (a product I sell). ※ It does not mean that past data will necessarily be the same in the future. This is not a recommendation to buy or sell.
All 3 Articles
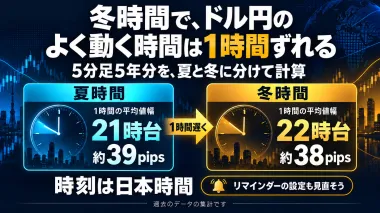
In Daylight Saving Time, the "most active period" for USD/JPY shifts by 1 hour; we calculated five years of 5-minute bars by splitting them into summer and winter.
On October 25 (Sun) in the United Kingdom and on November 1 (Sun) in the United Statesenter standard time (winter time).The times related to London an...
10/22/2026 19:50

Monday is quiet, Thursday is rough|Dollar-Yen 10 years, 2,585 days reveal the “weekday habit”
[New Product Introduction] I released the MT5 indicator "Omakase Horizontal Line Pro" that notifies you on your smartphone when your foot hits the hor...
10/15/2026 18:30
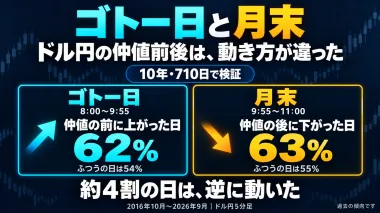
The Goto-day and month-end, around the midpoint of the dollar/yen, behaved differently|Counted over 10 years and 710 days
【New Product Introduction】 We released the MT5 indicator that notifies you on your smartphone when the price hits the level, “Omakase水平線 Pro” (the pro...
10/12/2026 18:30

Add to your blog

Frame color
  ※Please set your color
Text color
  ※Please set your color