
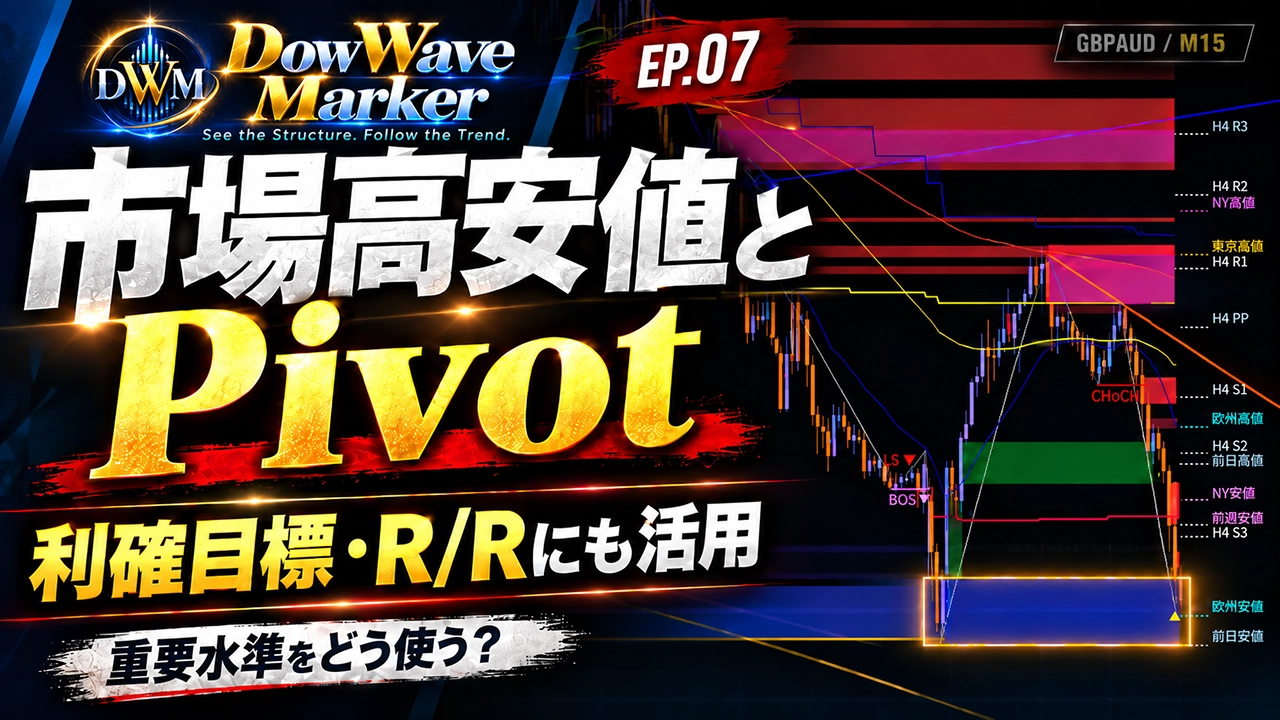
How to use market highs/lows and Pivot? Important levels usable for take-profit targets and R/R as well【DWM Practical Chart Analysis EP.07】
DOWWAVE MARKER | DWM Practical Chart Analysis Series EP.07
How to Use Market Highs/Lows and Pivots?
Important levels are not only for rebounds but also for profit targets and risk/reward judgments
By capturing market structure with CHoCH and BOS, and using market highs/lows, Pivots, and higher-timeframe moving averages, we will organize current position and exit strategy.
Are chart highs/lows and Pivot points only used for finding “places to wait for a rebound”?Yes, that is part of it, butthey are also useful when deciding exit targets for existing positions.
DowWave Marker (DWM) Practical Chart Analysis Series
In Episode 7, based on CHoCH/BOS market structure, we combine market highs/lows, Pivot, and higher-timeframe moving averagesto consider “where to focus” and “how far can we aim.”.
This episode’s theme isto determine buy/sell direction from market structure and organize exit and risk/reward (R/R) using important levels.
Reaching a level does not automatically confirm rebound or breakout.
Video: DWM Practical Chart Analysis Series EP.07

If playback is not available,Watch EP.07 on YouTube
01 / DOW WAVE STRUCTURE
First, look at CHoCH/BOS market structure
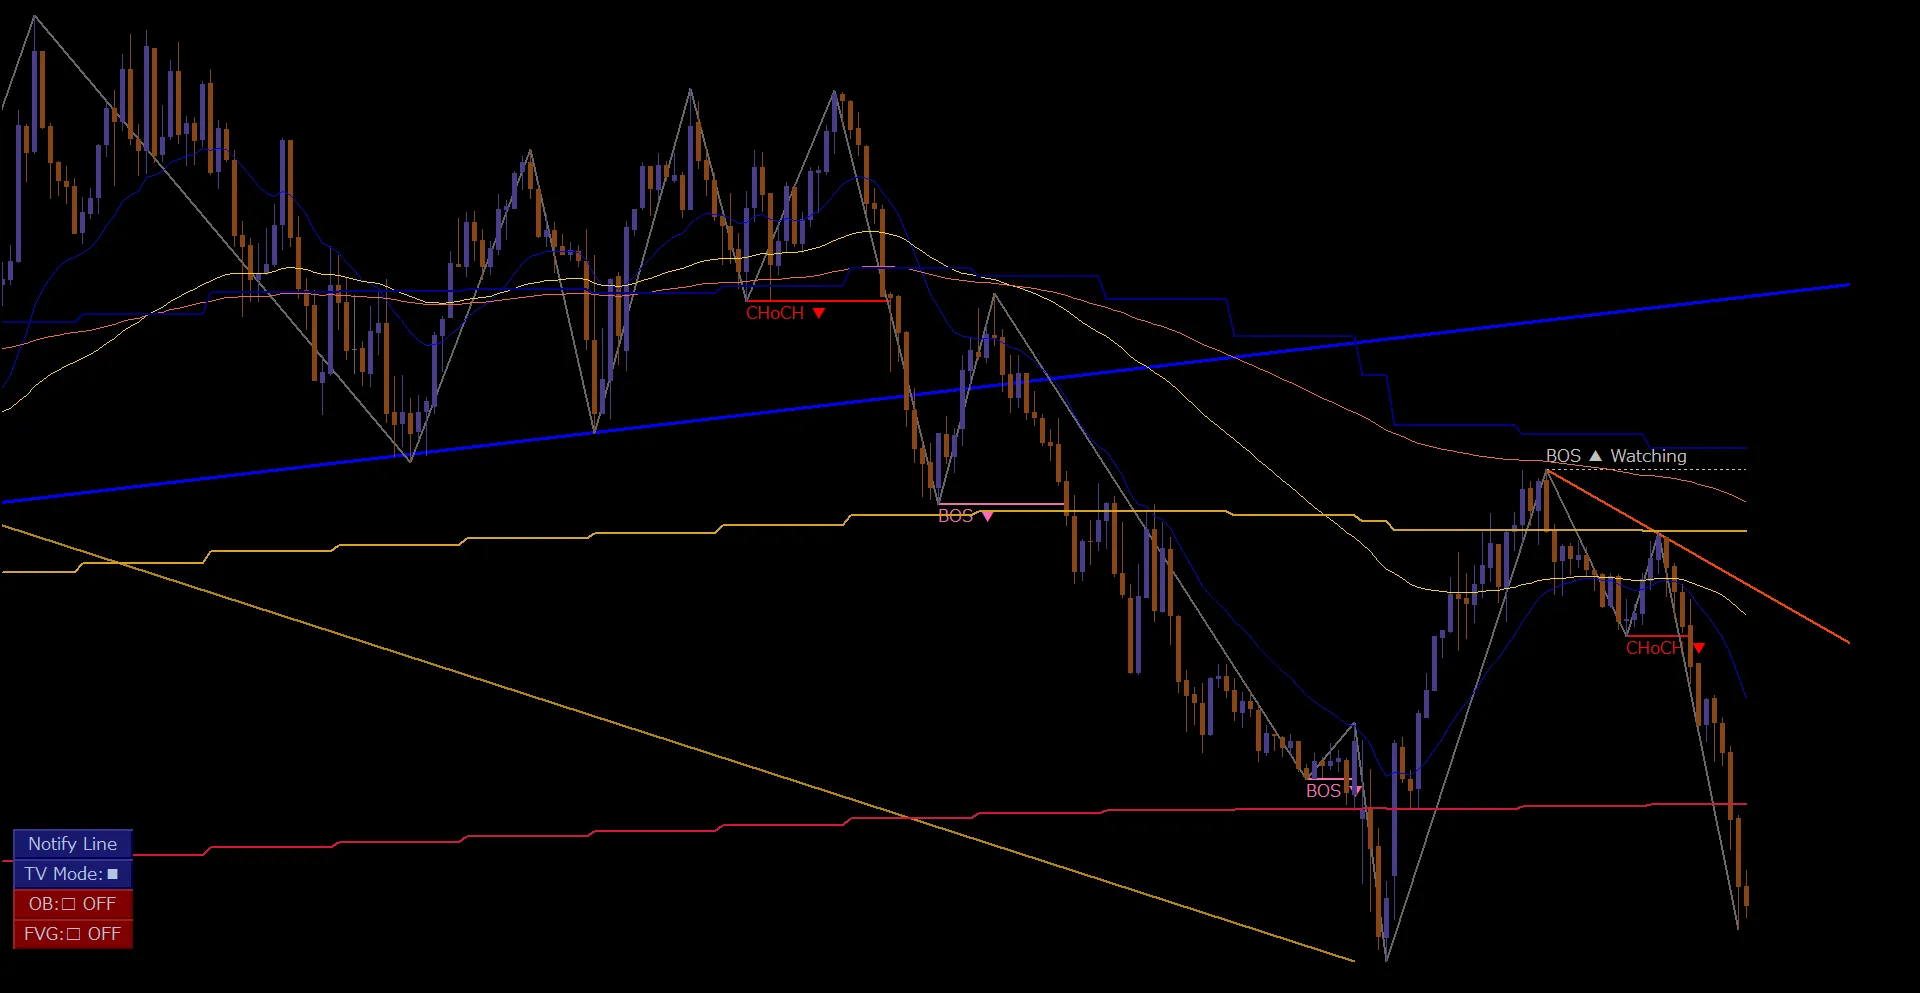
The main chart is GBPAUD (Pound/Australian Dollar) on a 15-minute chart.
By looking at candlesticks and Dow waves, you can整理 which direction the recent structure has continued and where changes occurred.
DWMhere,CHoCH captures when the market structure changes, and BOS reads the direction of the structure.
However, neither indicates that the displayed position is automatically a favorable entry.
02 / MARKET HIGH & LOW
Organize the “current price position” from market highs/lows
Market highs/lows in Tokyo, Europe, New York, and the highs/lows of the previous day/week serve as reference information to see where the current price sits relative to those levels.
On the GBPAUD/M15 chart at the right edge, European lows and previous day’s lows are displayed as lower reference levels relative to the current price.
After observing the downtrend, understanding the distance to these levels adds the perspective ofhow much room there is for a decline.
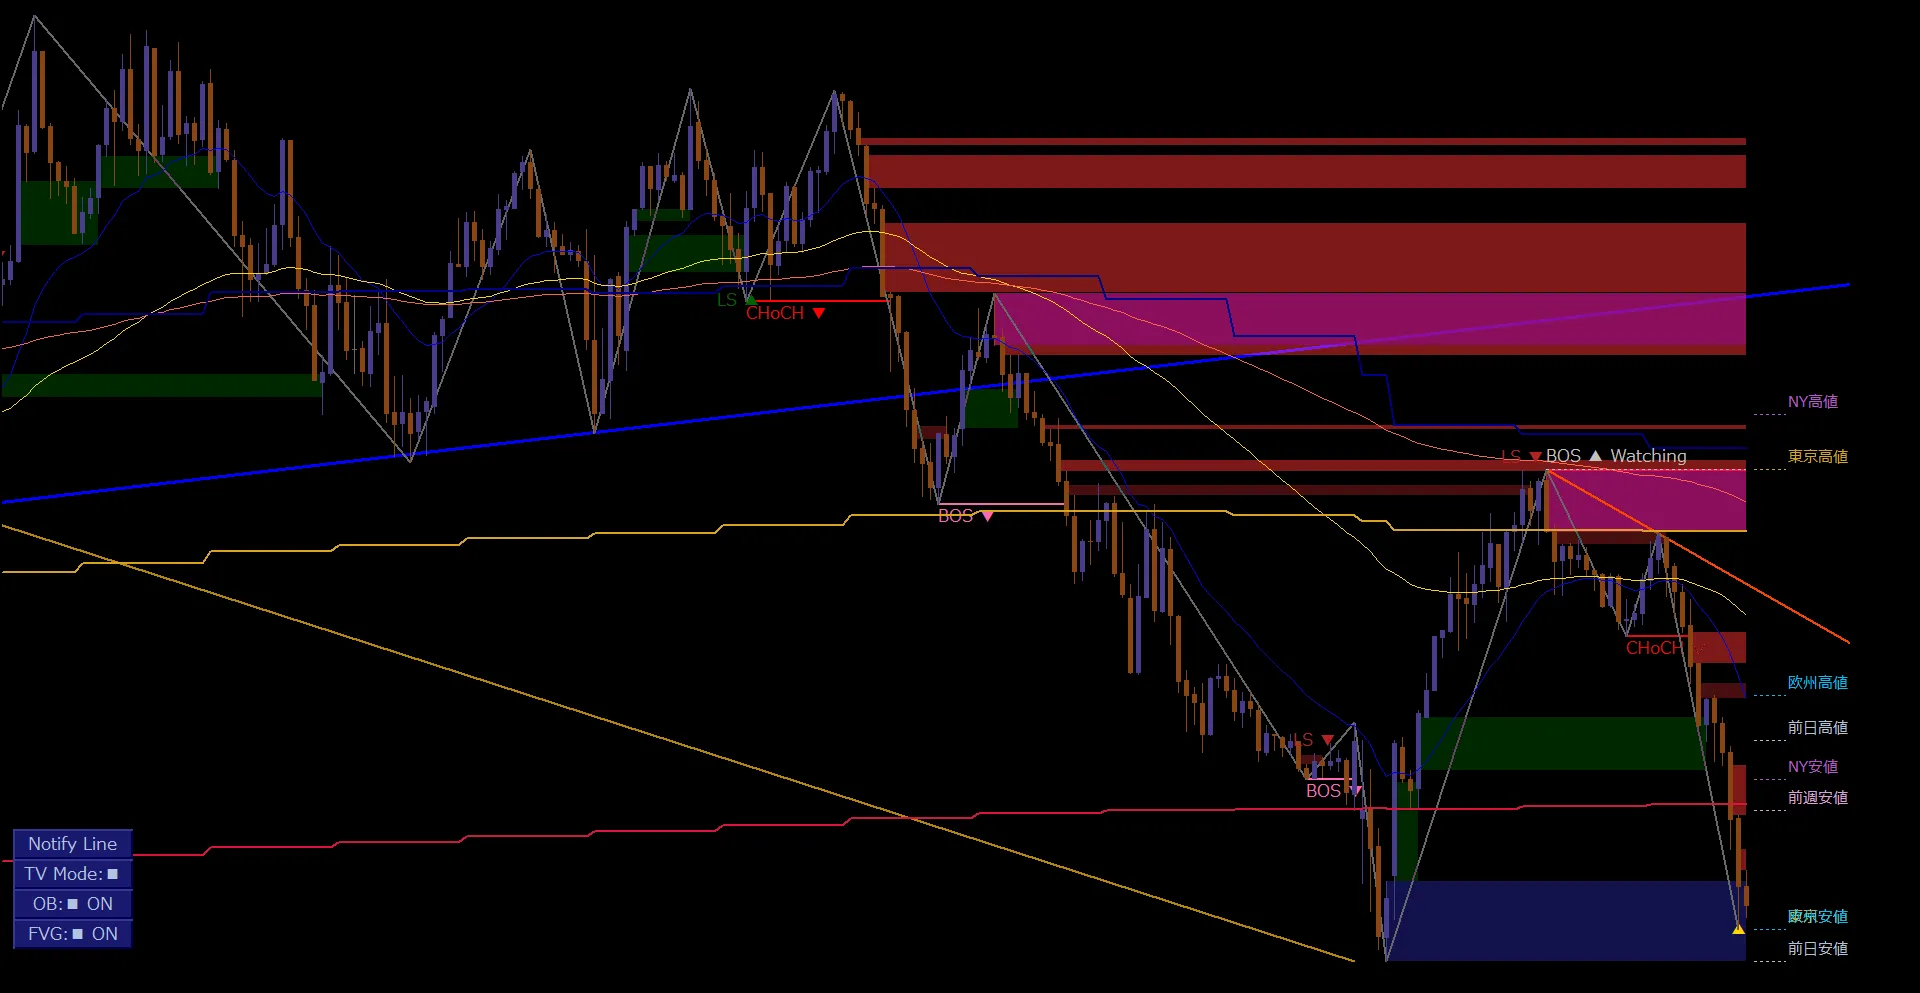
The displayed market highs/lows are not necessarily the day’s exact high or low.
Sometimes, before the market opens, the level from the previous business day’s most recent session may be shown.
This NY low is treated as the previous business day’s value.
Also, the market highs/lows label at the far right isthe reference level shown on the chart.
Applying that value back to past candlesticks to infer“that same level was displayed at that time as well”is not guaranteed.
03 / PIVOT LEVELS
Pivot is a reference level to view price movement up and down
Pivot is a reference level derived from price information over a certain period.
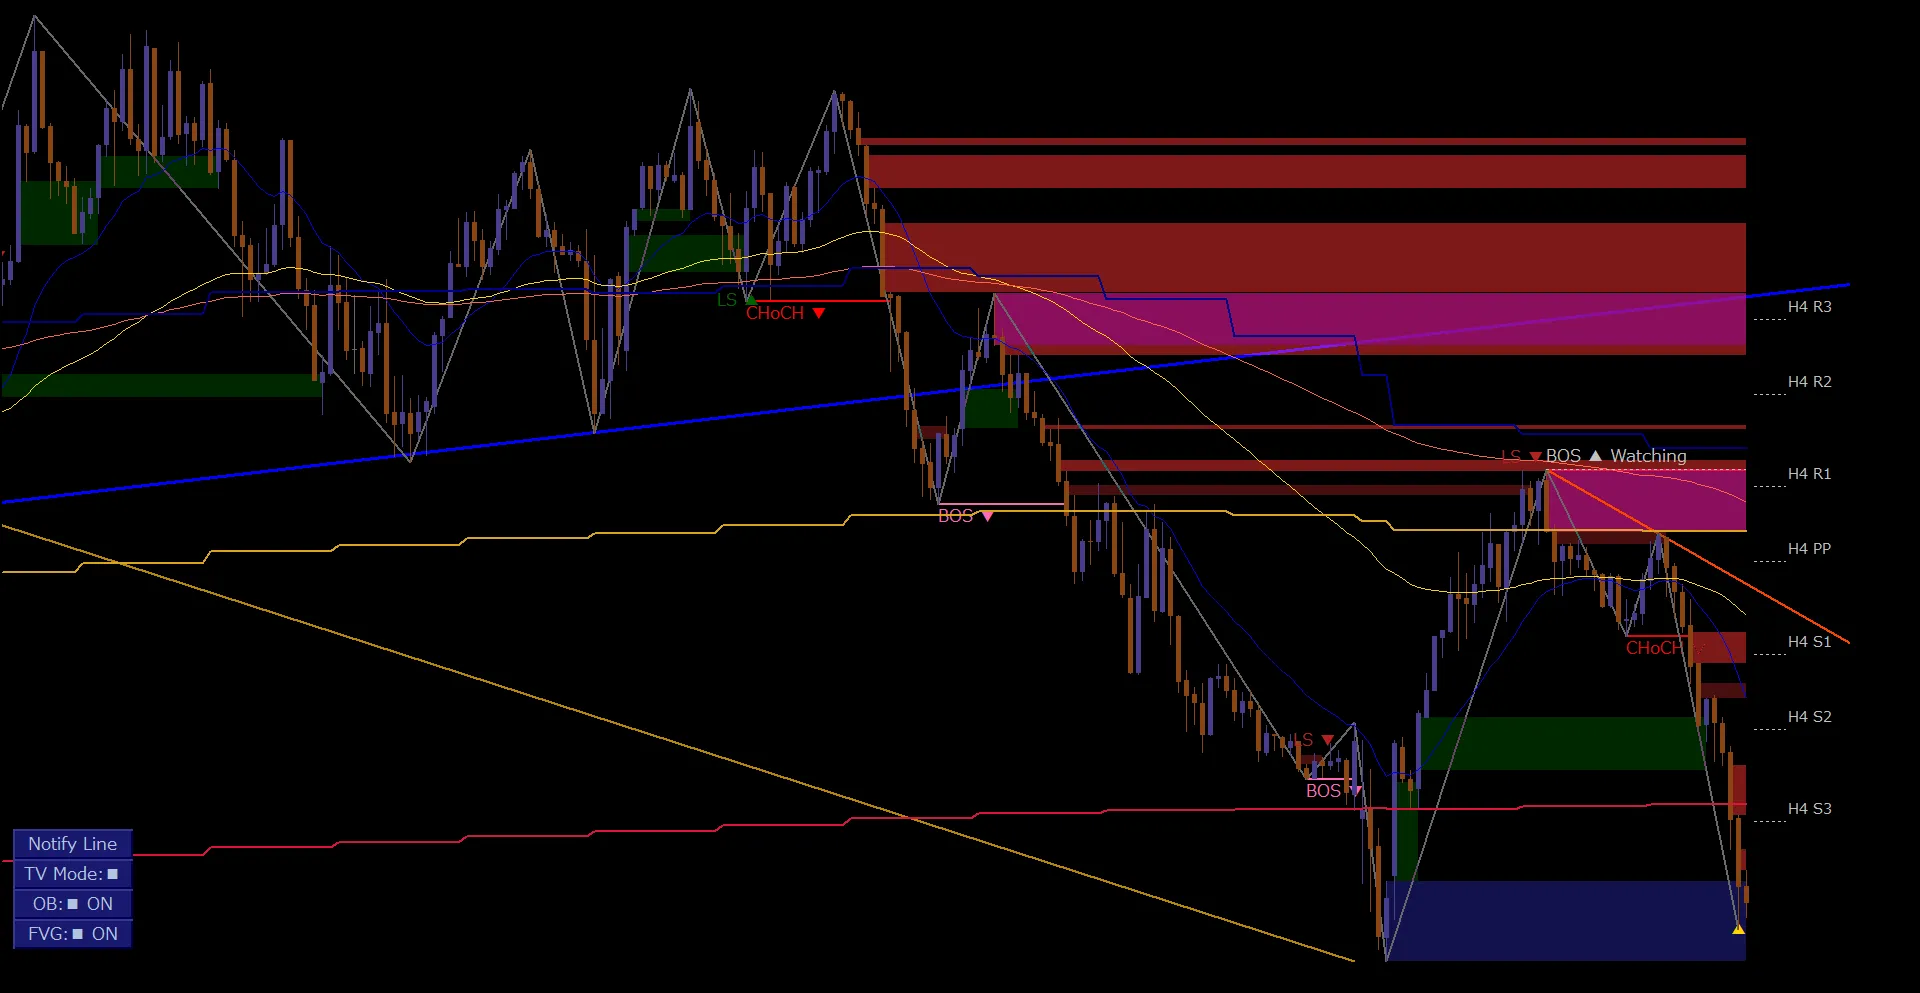
Using the central PP and the upper R1–R3 and lower S1–S3, you can organize where the current price sits.
In this GBPAUD/M15, Pivot based on the H4 (4-hour) chart is displayed.
The right edge price on the chart is below H4 S3.
However, breaking S3 does not mean a continued decline, nor touching S3 necessarily implies a rebound.
04 / PROFIT TARGET & RISK/REWARD
Important levels can be used for profit targets and R/R judgments
What I want to emphasize in this video isto use higher-timeframe moving averages, market highs/lows, and Pivot as profit targetsas a way of thinking.
In GBPAUD/M15’s downtrend, prices are capped near higher-timeframe moving averages on higher timeframes and break below the mid-term moving average on the execution leg.
Even if you use such movements as a basis for selling decisions,the question of where to enter is not the only consideration.
Downward, there are price ranges where longer-term moving averages on higher timeframes, prior week’s lows, recent NY lows, and H4 Pivot S3 converge.
Where several reference levels cluster can be a candidate for profit-taking on existing short positions.
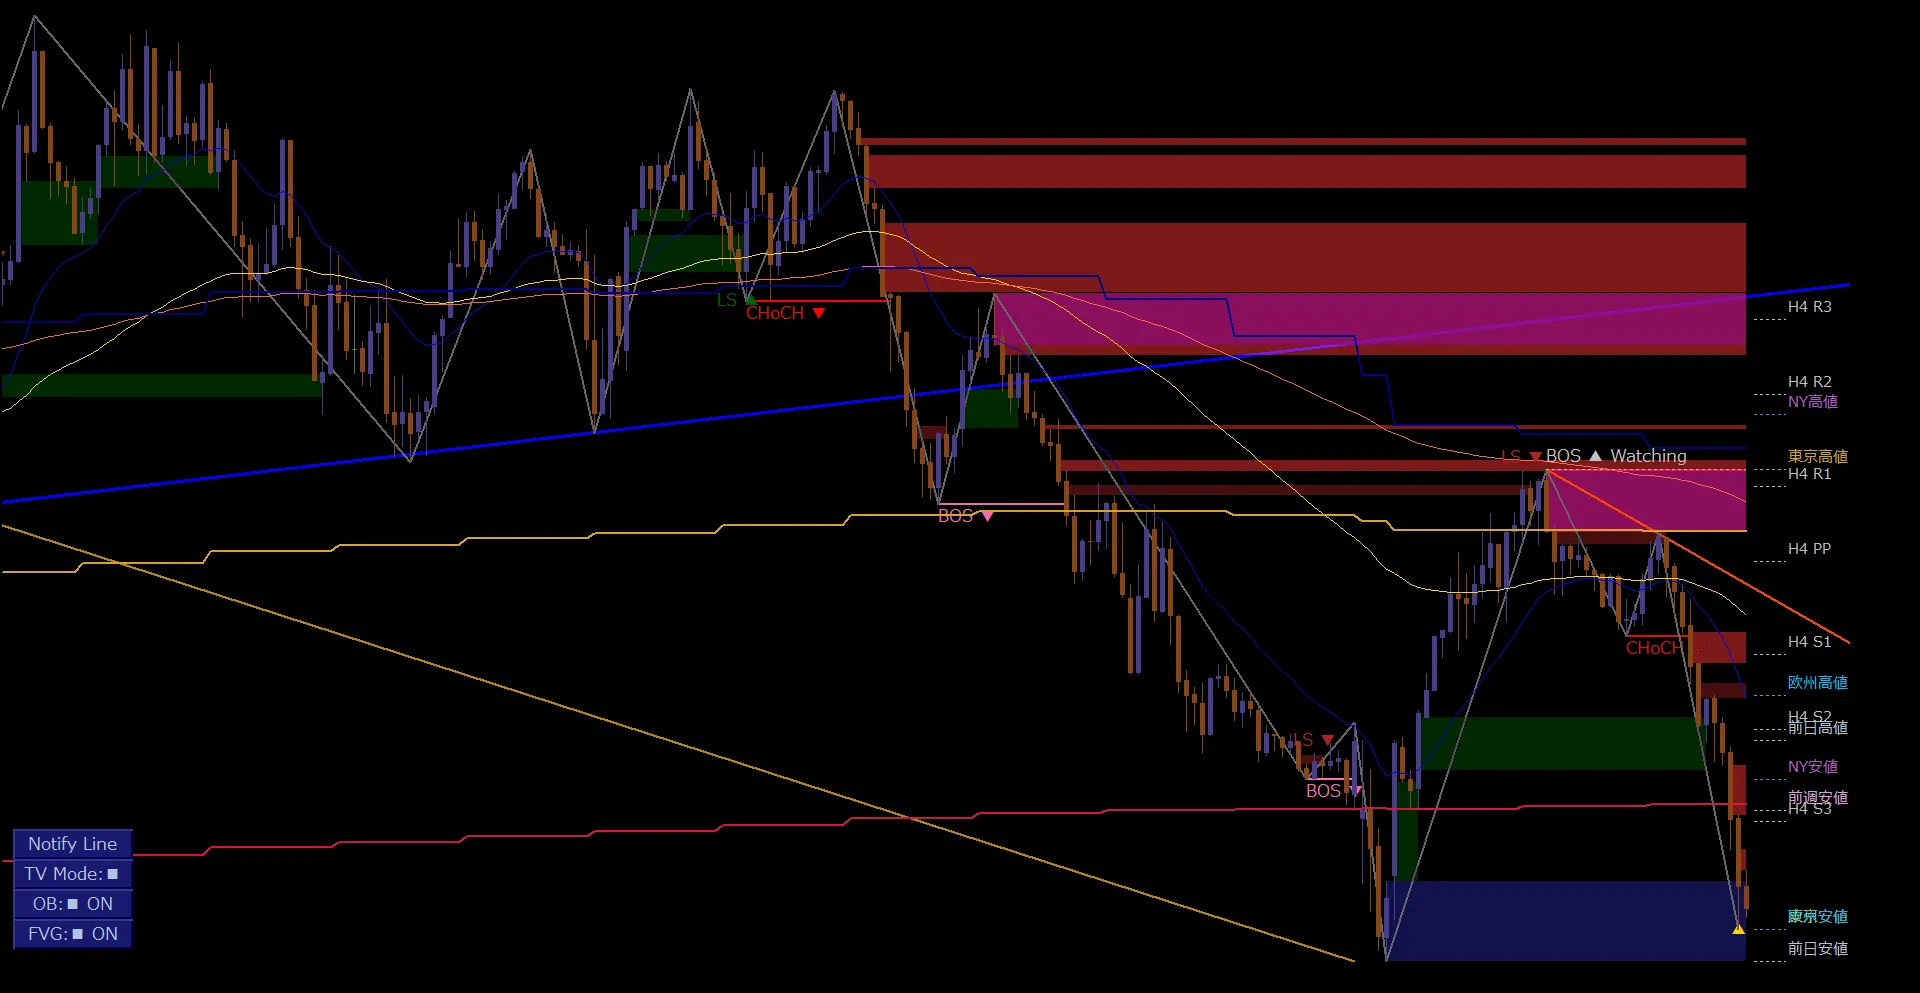
Compare the range from entry candidates to profit targets as “expected profit range” and from entry candidates to stop-loss as “estimated loss range,” thenR/R = expected profit range ÷ estimated loss rangeevaluate it.
Even if the direction is correct, if the R/R is not favorable, you may choose to pass.
Important levels do not always cause rebounds; price may move down to order blocks below them.
However,“If looked back, there was more room for profit”is a hindsight conclusion andnot the same as pre-setting an exit to manage risk.
05 / USDJPY / M15
In an uptrend, the upper levels become profit targets
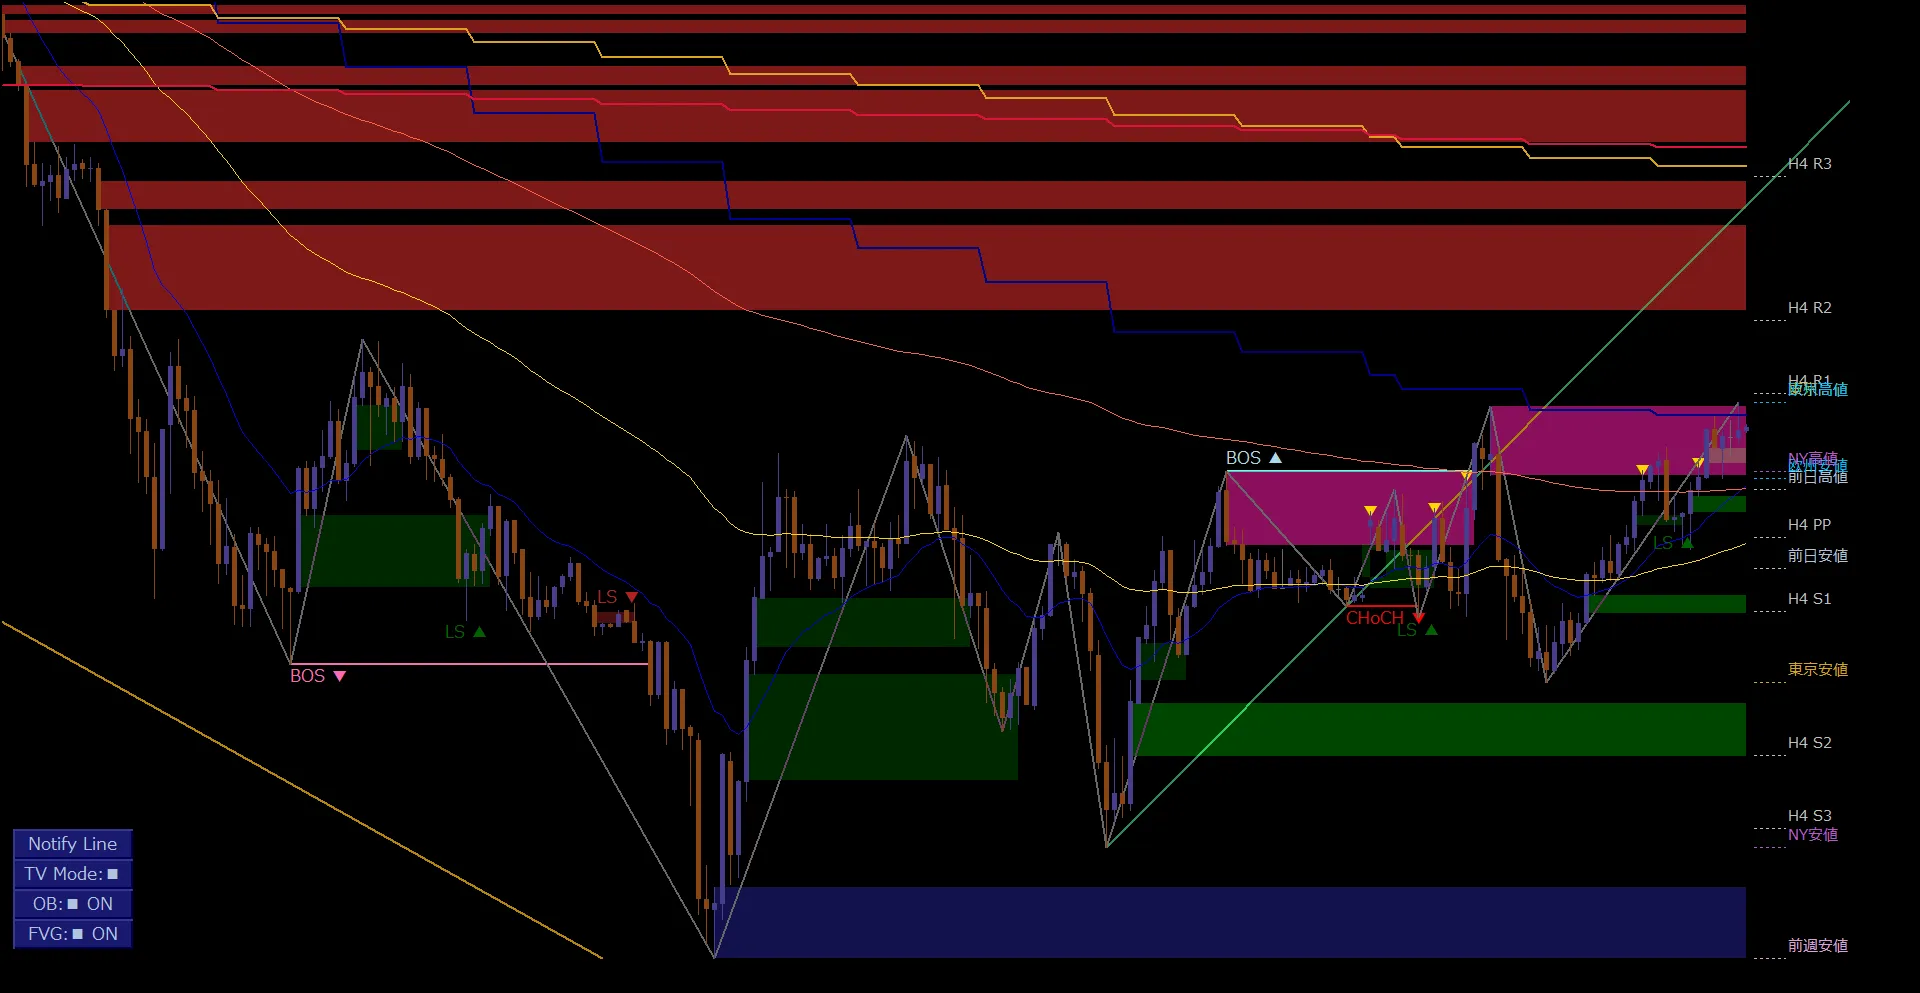
On USDJPY’s 15-minute chart, a rebound from a drop can transition into an up-move.
When focusing on the upside, also check European highs and H4 R1 above the price.
These levels serve as both rebound/ resistance candidates andpotential profit targets for long positions.
By watching approaching levels and considering exits, you can organize your buy decision and profit potential together.
06 / GBPJPY / M5
When there are many levels, organize by “closeness” and “structure”
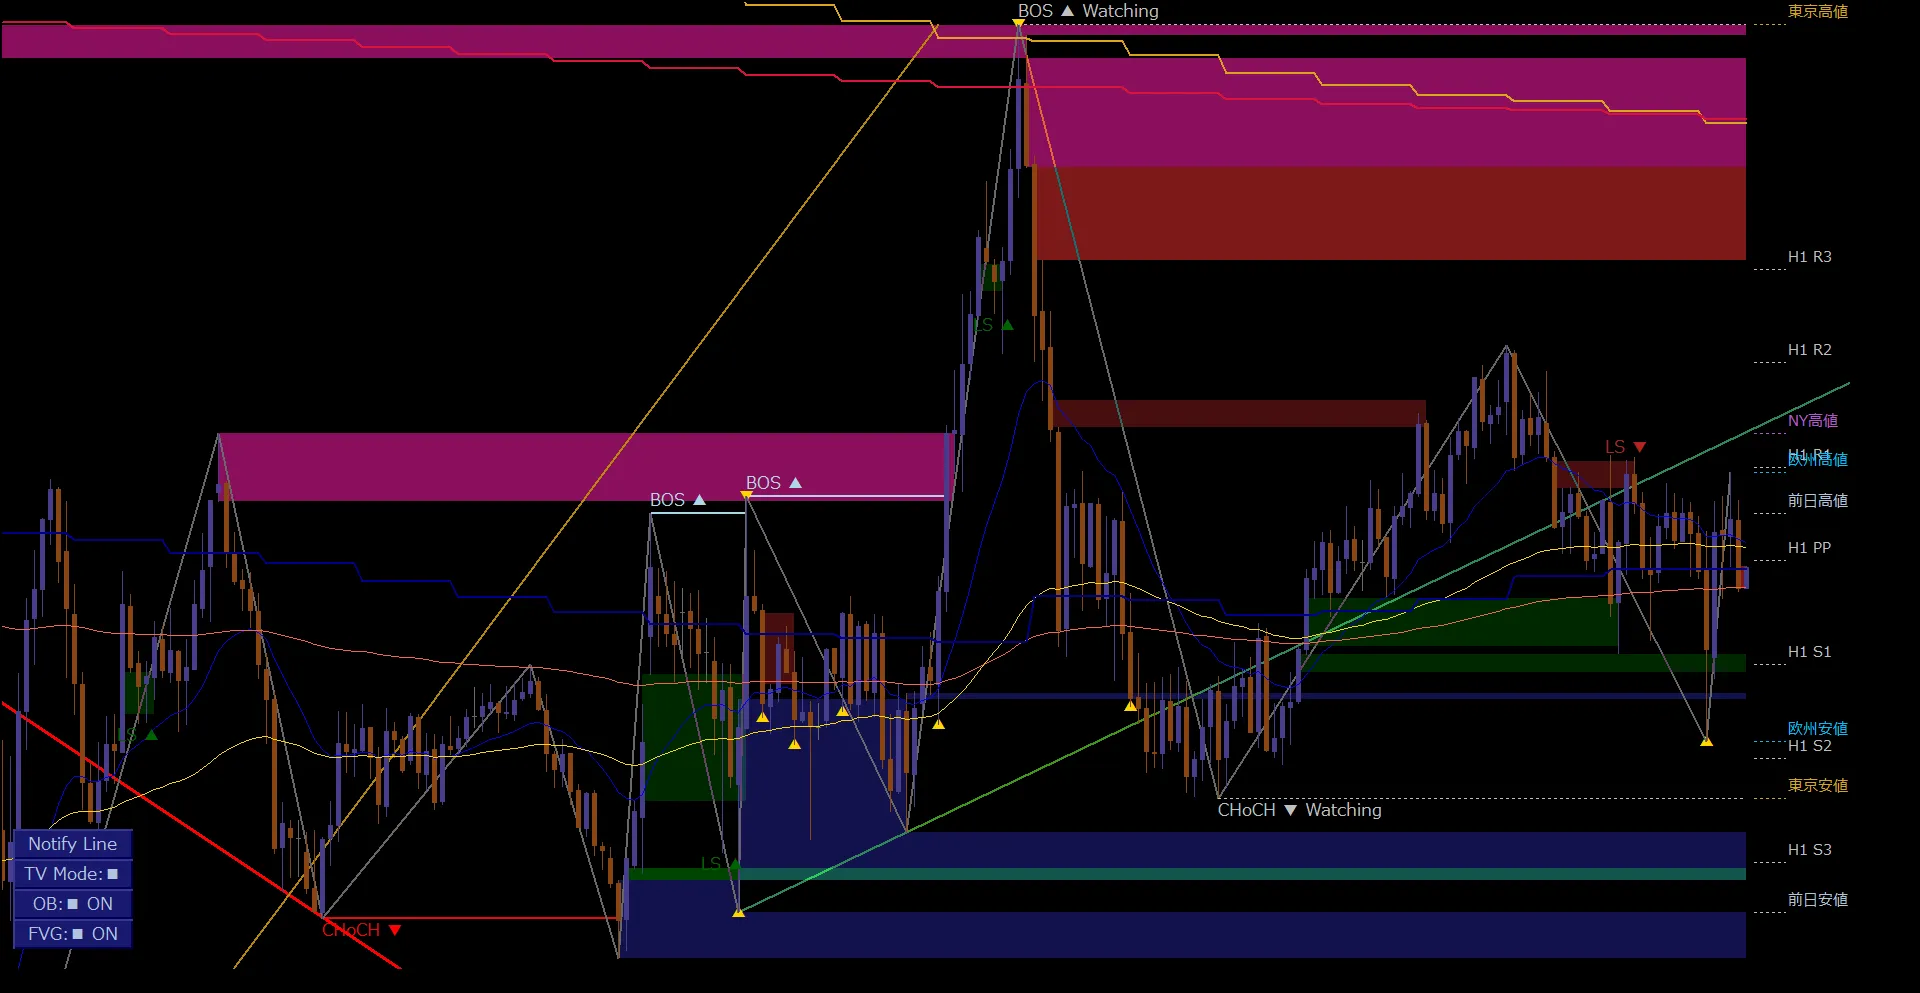
On GBPJPY’s 5-minute chart, price sits near H1 PP, with market highs/lows and multiple Pivot levels nearby above and below.
Rather than treating all levels with equal weight, organize which levels are closest to the current price and the potential entries in up or down directions.
Also, on the chart,“Watching”is an unresolved monitoring display.
Do not confuse it with confirmed CHoCH or BOS; observe how the structure updates.
07 / MULTI-TIMEFRAME PIVOT
Examples of Pivot display with different base timeframes
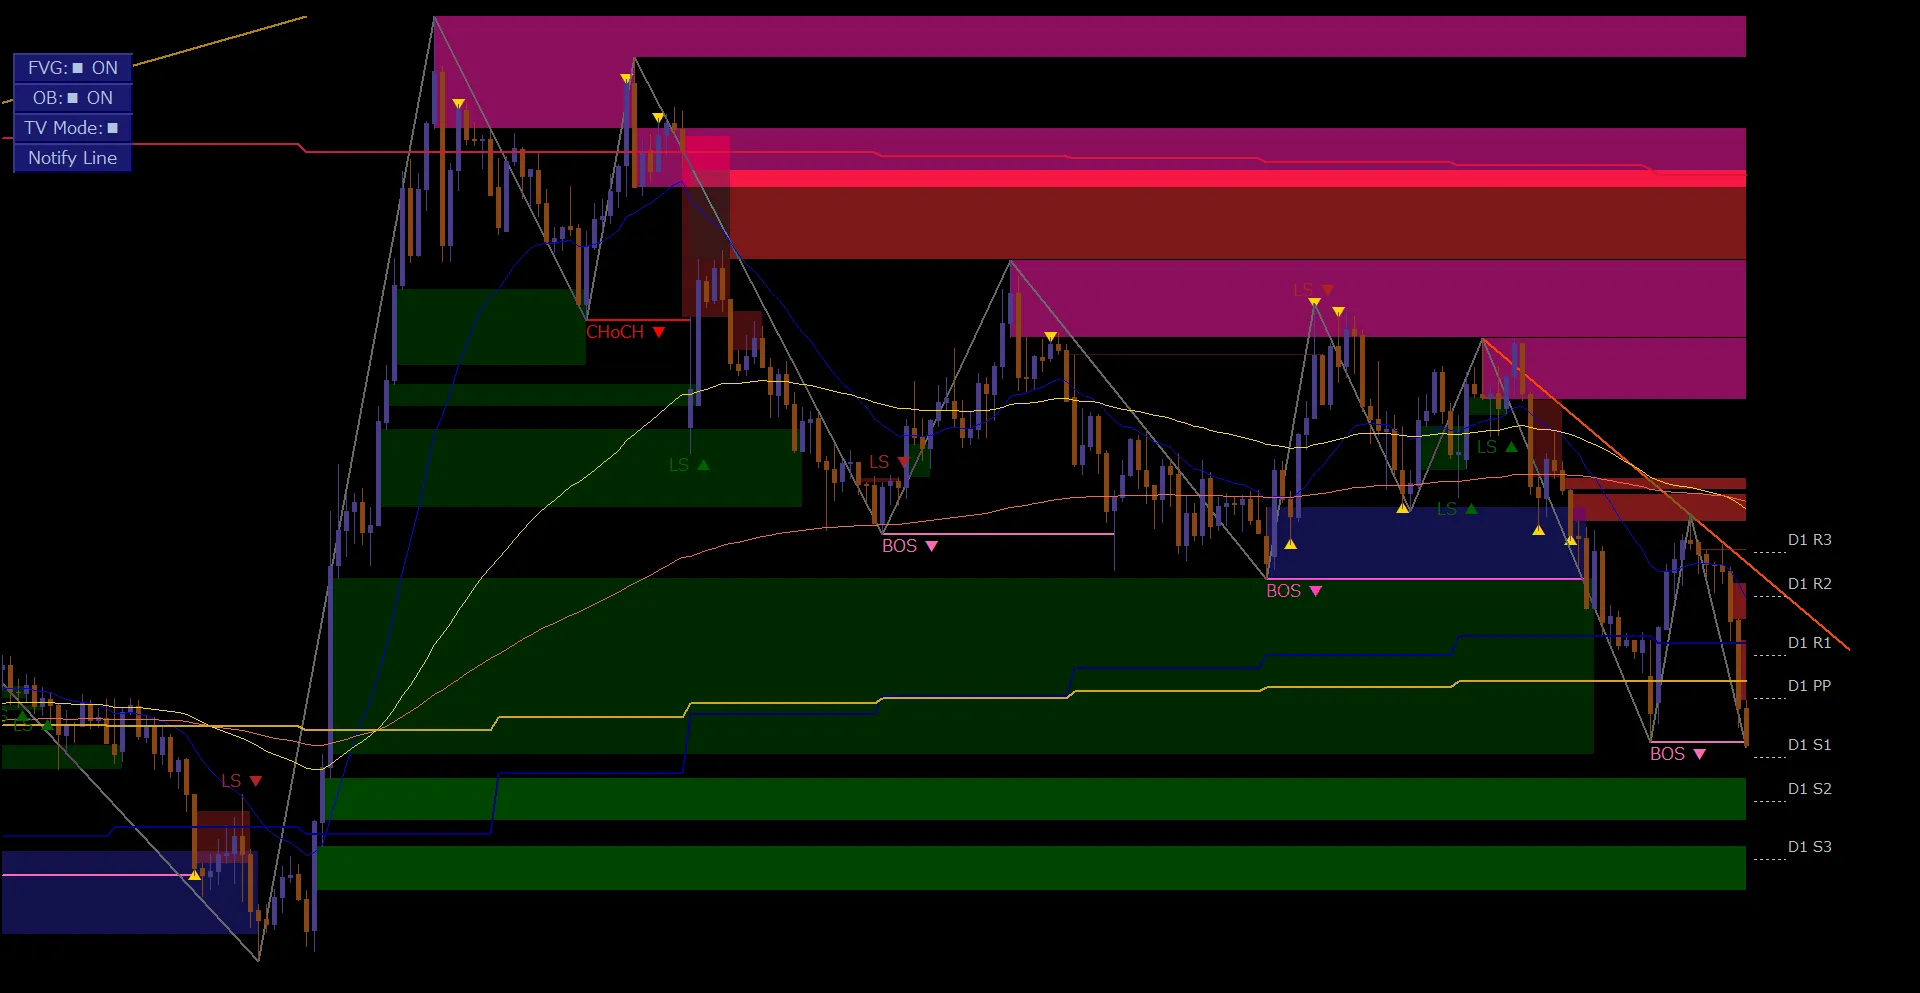
In the shown examples, GBPJPY/M5 uses H1 as the base, GBPAUD/M15 uses H4, and GBPAUD/H1 uses D1 Pivot.
Depending on the timeframe used, the reference levels on the chart may change.
From the standpoint of incorporating higher-timeframe information into execution decisions, this is useful, but these are examples of independent charts.
It is not a one-to-one mapping of higher-timeframe and execution timeframe values at the same time.
08 / PRACTICAL CHECK
Five decision steps using important levels
Just because many important levels overlap does not automatically strengthen a trading justification.
Consider market structure, current position, exit candidates, and assumed losses as a set,as this aids discretionary trading and situational awareness.
09 / DOWWAVE MARKER
From market structure to entry and exit decision materials
DowWave Marker (DWM)is a discretionary-trading-oriented environment awareness indicator that overlays Dow waves, CHoCH, BOS based on Dow Theory, execution and higher-timeframe moving averages, market highs/lows, prior day and prior week highs/lows, Pivot, FVG, Order Block, and more.
DWMis not a sign tool that guarantees trades.
It is a tool to observe structure, understand the current price, and organize next levels and profit opportunities.
10 / 14-DAY FREE TRIAL
Check your own charts with a 14-day free trial
In actual instruments and timeframes, see how market structure and important levels align.
DWMoffers a free trial so you can examine your own chart environment.
MT4 / MT5 compatible · SMC integrated model all features tested
DowWave Marker 14-day free trial
View the free trial →You can try the full-spec SMC integrated model for 14 days.
Details of the product:MT4 version/MT5 version
11 / SUMMARY
Summary: Important levels help before entry and while holding
In EP.07 we read GBPAUD’s downtrend by combining CHoCH, BOS, market highs/lows, Pivot, and moving averages on a single chart.
In USDJPY, upper-level profit targets; in GBPJPY, multiple levels and Watching; in GBPAUD/H1, Pivot base timeframe was also checked.
What is important is not to decide, “This should rebound here.”
It is about organizing decision materials that include where to enter, how far to aim, and where to撤回 the assumption (exit)so that you can manage risk.
See the Structure. Follow the Trend.Recognize market structure and trade with the trend.
※ Market highs/lows, Pivot, moving averages, etc., do not guarantee future price movement or profits.