
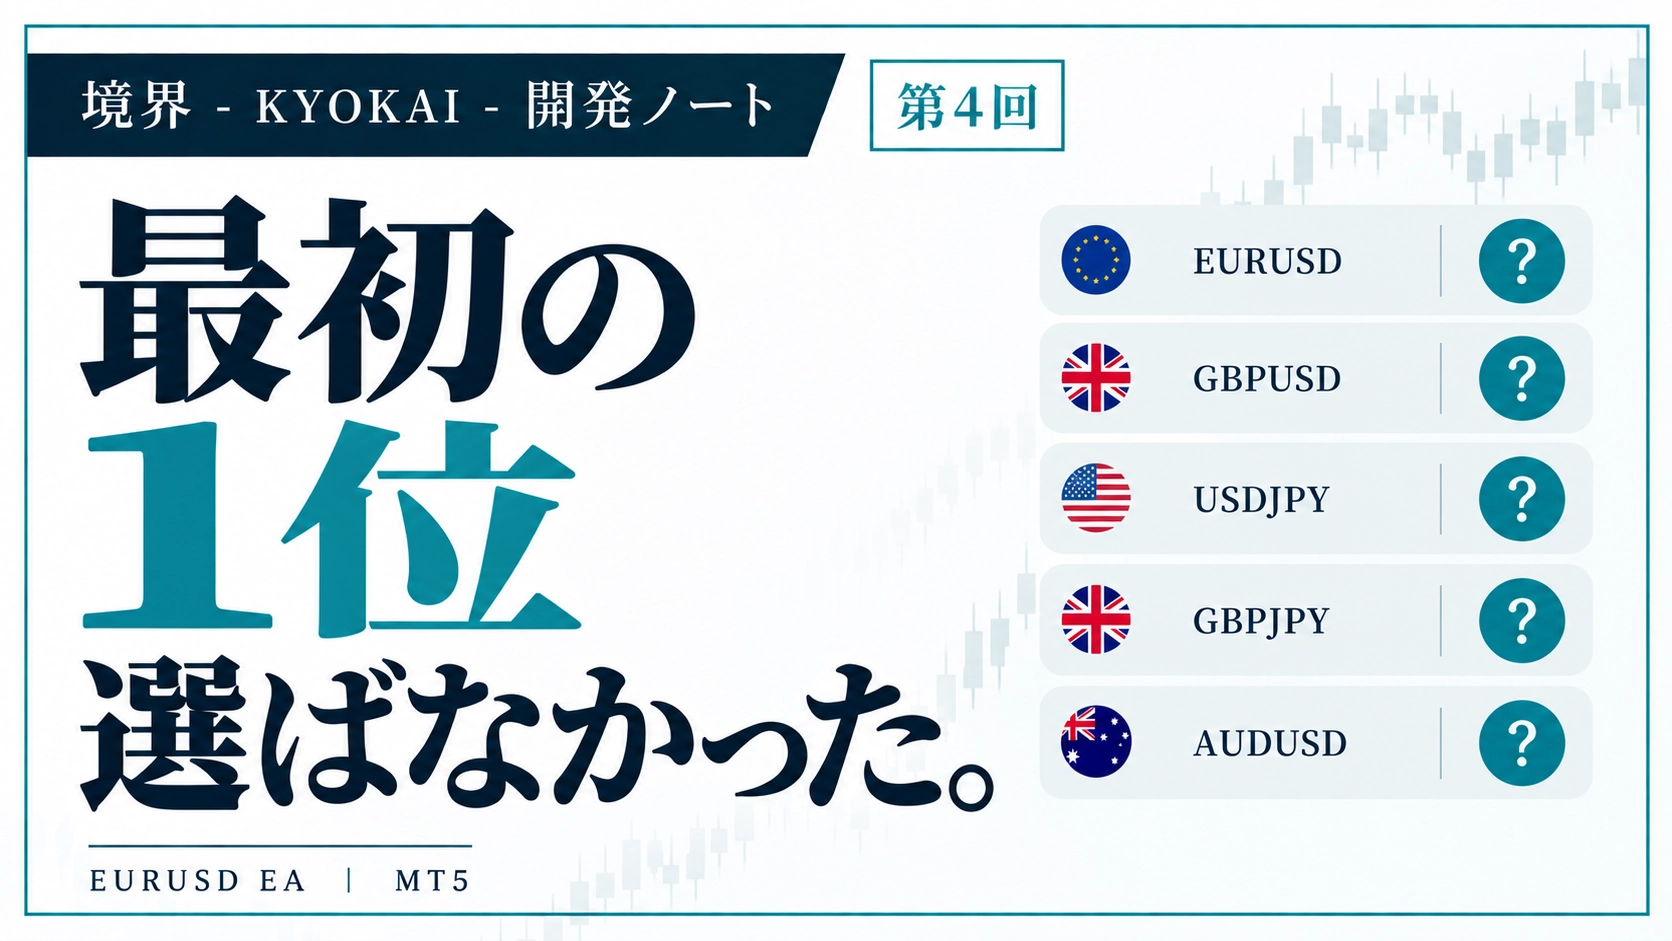
The currency that reacted best in the diagnosis was not the currency that earned the most money—it was until it became dedicated to EURUSD.
Until the completion of the EURUSD-specific EA "Boundary - KYOKAI -", what I tried, what didn’t work, and what I kept. I’m documenting the verification process.
» Product page for EA "Boundary - KYOKAI -" here
Boundary is EURUSD-specific. But from the start, it wasn’t that EURUSD was the target.
When I started the validation, I tested the same logic on five currencies: USDJPY, EURUSD, GBPUSD, GBPJPY, and AUDUSD. Then, why did only EURUSD remain? I’ll list the numbers in order.
In the initial diagnosis, EURUSD was not the top
This is an early diagnosis. I focused on "First Touch" that approached the line by 2 pips or more in the previous 60 seconds, and counted the rate of reversal one minute later by currency.
| GBPUSD 25 cases |
72.0% | |
| EURUSD 17 cases |
70.6% | |
| USDJPY 33 cases |
69.7% | |
| GBPJPY 49 cases |
60.4% |
※The bar length is the raw reversal rate (50% is a coin flip). These were from an early data set from the initial validation stage with a small number of cases.
The leader was GBPUSD, with EURUSD in second place. Moreover, the number of cases was only 17, the smallest among the four currencies. The gap from USDJPY was about 1 point.
From this stage’s data, there was no decisive reason to single out EURUSD.GBPJPY was slightly lower, but the remaining three currencies were almost on the same level.
When applied to actual trading, EURUSD stood out
The direction changed once I actually included TP/SL and let it trade. When I compared the performance of all five currencies and EURUSD for 2025 alone, it looked like this.
| All 5 currencies | EURUSD・2025 | |
|---|---|---|
| Number of conclusions | 136 | |
| Win rate | ||
| PF | 1.548 | |
| +13.53p |
Even across all five currencies, PF was 1.221 and positive. Yet when looking only at EURUSD, PF was 1.548 and average +13.53p, which looked quite favorable. This shifted the verification focus toward EURUSD.
That said, EURUSD is based on one year of data. With just that, one cannot claim "EURUSD is special." Next, I aligned the exit version with the others again to compare.
Final version aligned to exit, others largely not reproduced
Applying the exit-aligned logic to the other three currencies yielded these results.
| Currency | Cases | PF | Median H4 ATR | Share of wins by 2 ATR |
|---|---|---|---|---|
| EURUSD | 502 cases | 1.45 | 26.0p | 67.1% |
| GBPUSD | 512 cases | 1.06 | 32.8p | 61.8% |
| USDJPY | 505 cases | 1.07 | 44.7p | 56.0% |
| GBPJPY | 513 cases | 0.94 | 58.1p | 52.4% |
※Validation results from 2023 to August 2026.
The other three currencies had PFs of 1.06, 1.07, and 0.94. They were almost break-even or negative. In contrast, EURUSD showed annual differences: 2023 PF 1.22, 2025 PF 2.21.
Look at the two columns on the right as well. The median H4 ATR for EURUSD was the smallest at 26.0p, increasing in the order GBPUSD, USDJPY, GBPJPY. And the share of reaching the 2-ATR profit first ordered by currency with smaller ATRs was cleanly aligned (67.1% → 61.8% → 56.0% → 52.4%).
The currencies that showed little difference in the initial diagnosis became clearly different when including the exit.The diagnostic value and EA performance are different things.
Summary
- In the initial diagnosis, EURUSD (70.6%) ranked second after GBPUSD (72.0%) and was not decisive
- In actual trading, EURUSD・2025 appeared better with PF 1.548 than the overall PF 1.221 for five currencies
- In the final exit-aligned version, GBPUSD 1.06, USDJPY 1.07, GBPJPY 0.94, and other currencies were hardly reproduced
- EURUSD had the smallest H4 ATR (26.0p) and the highest 2-ATR lead rate (67.1%)
- The diagnostic value and EA performance were different. Therefore Boundary was made EURUSD-only
EA developed after this validation
Boundary - KYOKAI -
An EURUSD-only EA that targets First Touch of horizontal lines (R1, R2, S1, S2) with counter-trend entries. After the verification in this series, it reached its current form.
| Target | EURUSD-only, M15 |
| Entry | First Touch contrarian on horizontal lines (R1, R2, S1, S2) |
| Filtering | Bollinger Bands, ADX, higher-timeframe filter |
| Settlement | SL linked to H4 ATR and trailing |
Next time (final installment):Why I did not include the strong correlations found in the diagnosis as conditions. The final judgment before Boundary is completed.
※This is past validation results and does not guarantee future performance.