

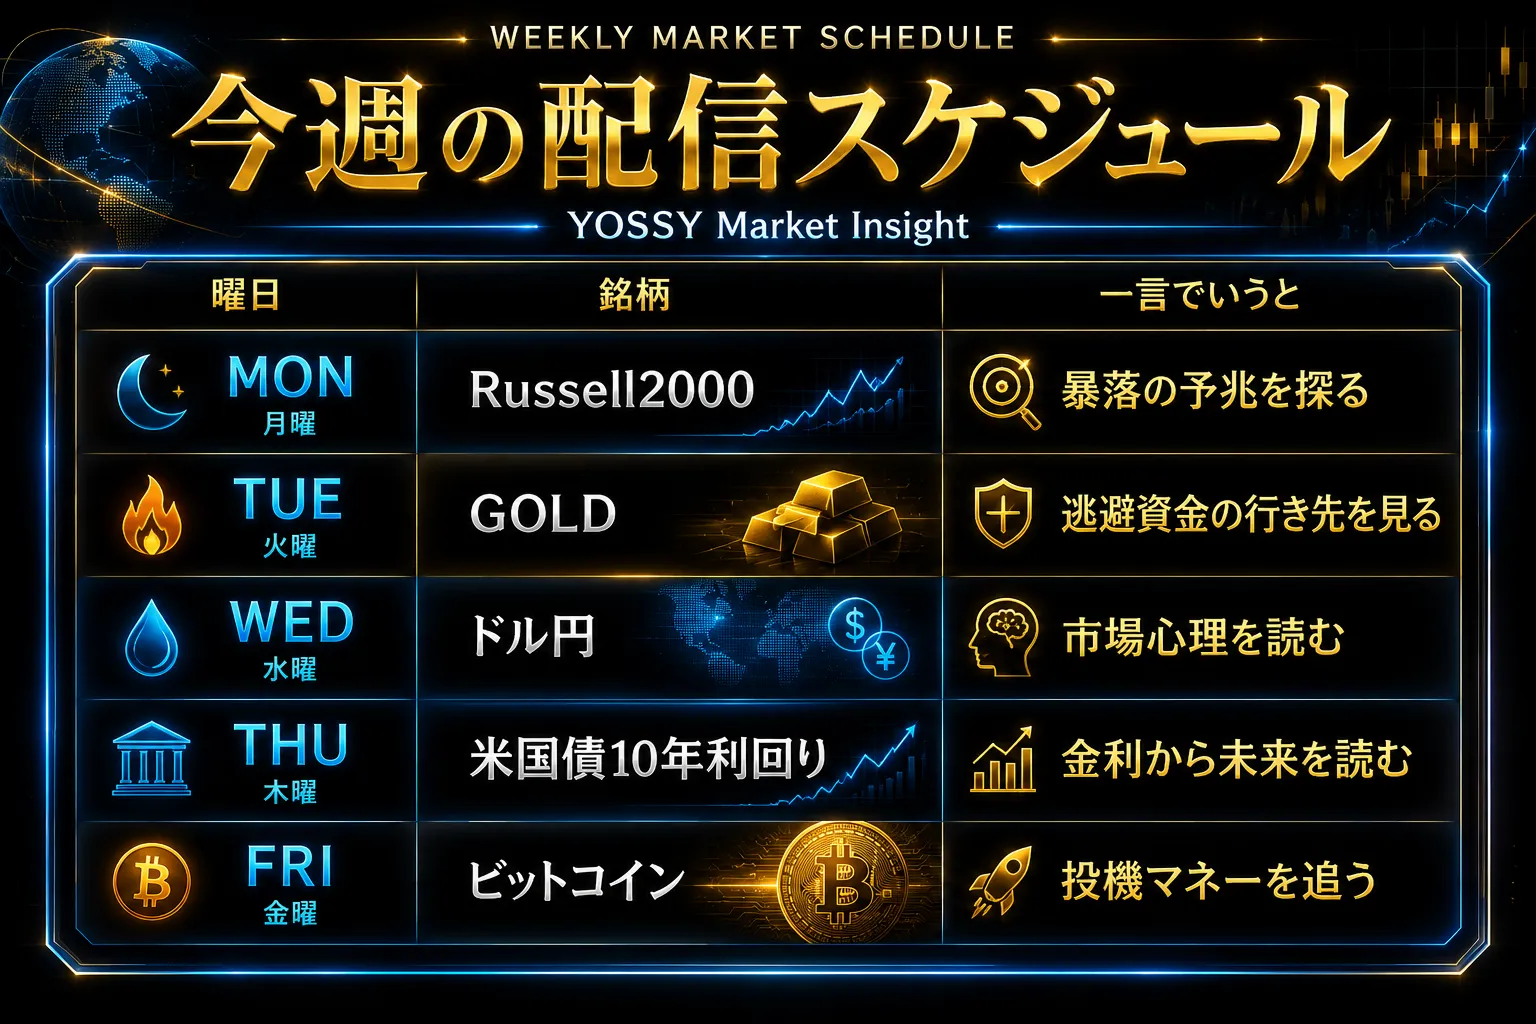
July 22 (Wed): 【BB&HM】 Nikkei 225 vs USD/JPY
【Notice】
I will be returning to my wife’s family home from Tuesday until the end of July.
Therefore, there may be delays in posting the newsletter and replying to inquiries, please understand.
This time
『USD/JPY』
comparison will be made with.
【Overall Scenario Probability】
This week's overall market is…
「Rise: 45% / Fall: 55%」
※ We are cautious about the weight of the USD/JPY and stock indices.
※ Presented as a reference level.
【This Week's Market Focus Points】
In the S&P 500, new detections of 【Shark】↑, and in the Russell 2000, 【Bat】↑ & 【Crab】↑ have been detected, signaling renewed bearish caution in U.S. stocks.
On the other hand, USD/JPY has broken above the triangle support, and there is little obvious resistance on any time frame. The big focus this week is how to interpret the inverse correlation between stocks and currencies. Detailed explanation will be in the paid section.
➥The continuation is explained in detail in the member-exclusive report.
If you have not registered yet, please click here ↓
【Integrated Version】
‘Why does the market stop there?’ Bollinger Bands × Harmonics: A fusion of statistics and geometry to capture market turning points with high precision!
https://www.gogojungle.co.jp/finance/navi/series/1613?via=articles_detail_aside
(*From here on, access is limited to members。)
--------------------------------
【Environmental Recognition】