
#20 [Verification Complete] A Story Where Combining “Sniper” and “Machine Gun” Made the Wealth Curve Become an “Art”
December 4, 2025: Note
In my previous article, I declared the following.
“The daily chart (Sniper) and the 4-hour chart (Machine Gun), these two will be forbidden to merge... will be hybridized.”
Let me be honest.
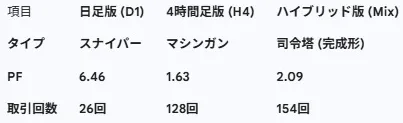
Since each on its own has produced impressive numbers (PF 6.46 and PF 1.63), it should be fine to run them separately.
Consolidating them into a single source code might seem crazy when you consider the programming effort involved.
However, my FX practitioner instincts were telling me otherwise.
“If you mix them, they become the strongest.”
This time, finally completed“Hybrid EA”— its full picture and backtesting results far exceeding expectations — are being revealed.
Why “Hybrid”? The theoretical sketch
Before starting development, I had formed a hypothesis about this fusion.
From a money-management perspective, the specification was
to run the two with half the lot size each (0.05 each).
If you think about it simply, you might expect profits to be about half as well, right?
But it’s not that way.
What I was aiming for was not mere addition.
“Chemical reaction (synergy)”.
Downdraft offset
As D1 and H4 complement each other’s drawdown (loss periods),the asset curve should become smooth.
Acceleration of compounding
When the asset curve stabilizes, the timing for increasing lots via the “compound interest feature” (Dynamic Lots) may move up earlier.
Something more than just a simple addition of two numbers will occur...
...I was convinced of this and proceeded with coding.
This is the hot part! Three advantages
After running the completed EA, the hypothesis hardened into conviction.
This hybrid version, to be blunt,is incredibly hot.
1. No idle time!
The daily version’s weakness was too few entries.
But in hybrid form, while the daily chart stays quiet, the H4 keeps earning steadily.
The enemy of traders, “boredom,” is superbly filled by the H4.

H4 version
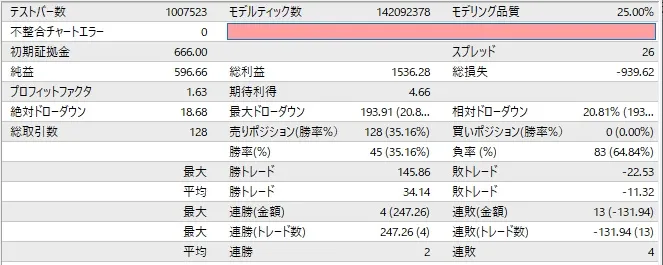
H4 version
2. Dramatic rescue
Conversely, when the H4 is caught in market noise and suffering drawdown…
the daily chart will come in and save in one strike with “waited for you” power.
This coordinated play is thrilling to watch.

Daily chart version
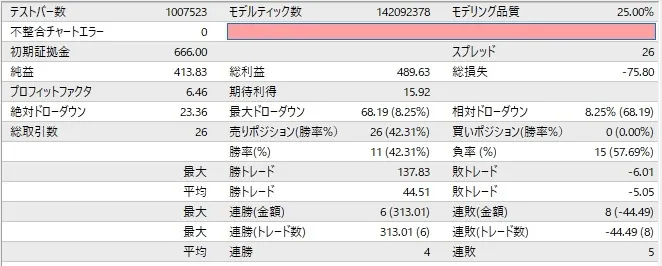
Daily chart version
3. Asset curve becomes “art”
A graph that was choppy on its own becomes extremely smooth as the two waves overlap.
This is not only beautiful but also yields the strongest advantage: mental ease.
And as the capital grows more steadily, the timing for accelerating compound becomes earlier.
Indeedthe “acceleration of compounding”.
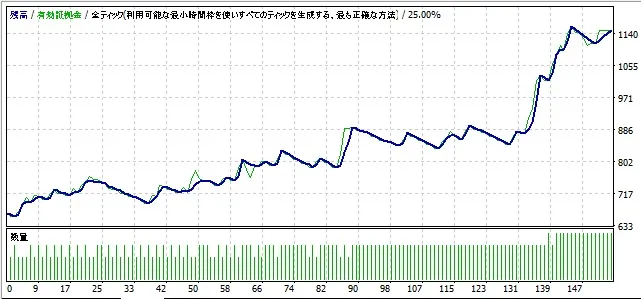
Daily + H4: Hybrid version
Daily + H4: Hybrid version
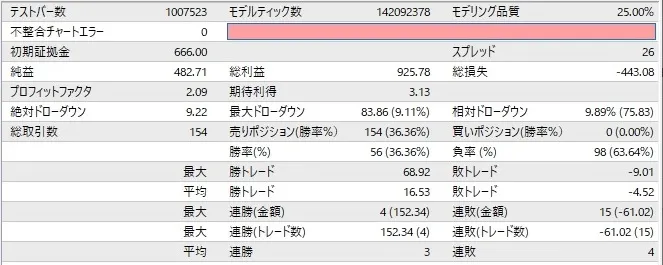
【Result】 The numbers prove the “completed portfolio”
Now, more proofs than arguments.
Let’s compare the backtest results from the most recent three years.
What I want you to note here is the hybrid version’s number of trades.
“26 trades (D1) + 128 trades (H4) = 154 trades”
With not a single deviation, two logics function completely independently and coexist in one account.
Hybrid version trades as daily + H4, but why is its profit lower than H4’s?
The reason is“to ensure safety, the lot size is halved”.
When using only H4 versus the hybrid, the amount risked per trade differs.
Explanation of the mechanism
H4 standalone :
・ With $666 capital, traded at 0.1 lots (full power).
・ Profit is also exactly the 0.1 lot value.
Hybrid version :
・ With $666 capital, to keep risk constant, the capital is split into “0.05 lots on D1” and “0.05 lots on H4.”
・ In other words, within the hybrid, the H4 logic earns at only half the power of the standalone version (0.05 lots).
Rough calculation...
Take the standalone version’s profit (scaled to 0.1 lots) and halve it, then add.
・ D1 profit ($413) ÷ 2 = about $206
・ H4 profit ($596) ÷ 2 = about $298
・ Total estimate = $504
The hybrid version’s actual profit was $482.71.
In short, this is what it means
The hybrid version prioritizes maximizing safety (smoothing the graph) over maximizing profit.
If you want higher profit even if risk doubles (sum to over $1,000), you can either double the capital ($1,332) or double the risk setting to achieve it.
But the current setup (profit $482) is superior in terms of investment quality (PF 2.09):“With the same capital of $666, the drawdown risk is reduced and growth is stable.”This makes it an excellent performance in terms of investment quality.
If you only look at the profit amount, you might think “huh?” but the “quality (stability)” has increased dramatically.
Conclusion
The sniper’s “one-shot kill” and the machine gun’s “overwhelming power.”
These two opposing traits have merged beautifully, canceling each other’s weaknesses.
This is the finished form of portfolio management.
There is nothing more to tinker with.
The daily chart’s accuracy, which can be called “supernatural,” and the gritty persistence of the 4-hour chart to earn,
the strongest EA, equipped with these two, has been born here.
Now, the product is ready.
Next, we begin the phase of releasing this monster to the world.
Mymasterpiece, please look forward to it.
Next:
“Shall we talk about optimization?”
If you set your mind to it, you can build an EA that wins every year for three years and makes a fortune.
But I won’t do that.
Why not…
※
The EA I’m developing is automation for a method you can manually realize, which I introduced in Part 2
“A method that wins even without scalping”automation of that method.
This serialized story’s (so far) only paid article.
<150 yen!Cheap!... President, cheap! ٩(ˊᗜˋ*)و
× ![]()